
Tugas:
For Bisgen 2,3 : Case Study Indonesian Retail Industry
| Supermarket Name | Average Monthly Sales (Rp Billion) |
| Hypermart | 195.0 |
| Transmart Carrefour | 182.5 |
| Superindo | 177.8 |
| Lotte Mart | 162.4 |
| AEON Mall BSD | 159.6 |
| Grand Lucky | 153.0 |
| Ranch Market | 148.5 |
| Farmers Market | 144.2 |
| Naga Supermarket | 139.4 |
| Tip Top Supermarket | 139.4 |
| Yogya Group | 133.7 |
| Hari Hari Pasar Swalayan | 127.8 |
| Alfa Midi Premium | 125.0 |
Tasks
- What does the difference between mean and median indicate about the data distribution?Use Excel
- What are the interpretation of above result (ad.1) ?
- If AEON Mall BSD’s sales increase to Rp180 billion next year, how will it affect the mean?
- Which measure (mean, median, or mode) best describes the ‘typical’ supermarket’s performance and why?
Status: 100% telah tercapai
keterangan : Saya telah mengerjakan tugas dengan baik dan benar
Jawab:
1. 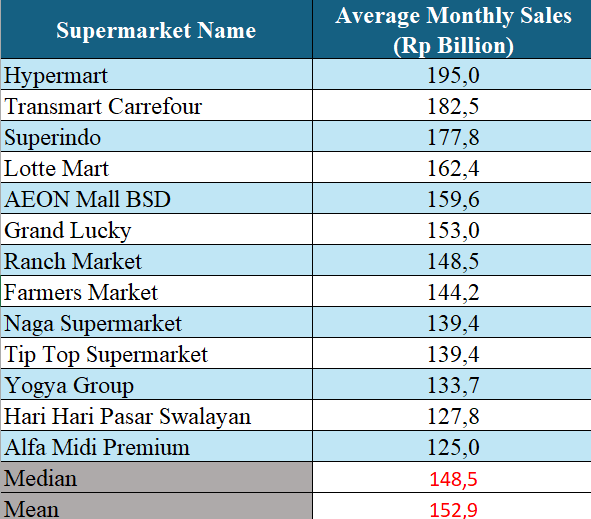
2. All of the retail sales recorded an average income above 100 billion. The highest income was generated by Hypermart, reaching 195 billion, while the lowest was Alfamidi Premium with 125 billion. The difference between the two is approximately 70 billion..
3. This will affect the final value of the mean. The mean will change if one of the variables experiences a shift in value.
4. Among the three measures, the mean is the most effective for assessing the overall performance of all supermarkets. By using the mean, we can determine the average monthly income, and if there is a change (increase or decrease), it may indicate a shift in consumer economic behavior. For instance, if the average income drops, it could be due to a decline in purchasing power caused by economic instability.